I sat down at my desk around 3:30 PM and found a scheduled task still running. It had fired at 7:31 AM that morning. The job it was supposed to do takes about three minutes.
My current session read 60% used. The weekly “all models” bar read 16%. I had not touched Claude all day.
My first instinct was that someone else was on my account. That turned out to be wrong, and the real answer was more interesting: my own scheduled task had been stuck in a loop for eight and a half hours, re-writing the same paragraph, because the thing running it would not accept “I’m done” as an answer.
Here’s the full chain, the receipts I used to trace it, and the checklist I’d give anyone running unattended agents.
Key Takeaways
- A daily scheduled task on Claude Opus 5 ran from 7:31 AM to roughly 4:02 PM instead of its usual three minutes.
- Root cause: the task called Gmail and Calendar tools that were approval-gated. A scheduled run is unattended by definition, so nobody was there to approve. The run was dead on arrival, every single morning.
- The expensive part was not the failure, it was the retry. The model correctly concluded “run failed” and stopped. The scheduler re-prompted it anyway, dozens of times, and every iteration re-sent the entire growing transcript.
- Pressing stop did not stop it. When I finally found the run and hit Claude’s stop button, it carried on regardless.
- It ended wedged on
API Error: 400 messages.56: user messages must have non-empty content, a state that “Try again” can never clear. - This cost a limit window, not money. Weekly limits reset. The account’s usage-credit meter read $0.00 that same evening.
- There is no per-conversation usage breakdown in Claude, so “where did my limit go” is currently only answerable by digging through run history.
What happened: the 8.5-hour timeline
The task was called “Refresh personal dashboard.” I created it on July 27, 2026 through claude.ai’s Scheduled feature. It ran daily at 7:31 AM on Opus 5 at high effort, and its job was mundane: run three Gmail searches for bank, job, and GitHub alerts, pull the next seven days from Google Calendar, build a small self-contained HTML dashboard, and update a desktop artifact.
Here is the shape of what actually happened, drawn against the two timestamps I can prove and the one I observed.
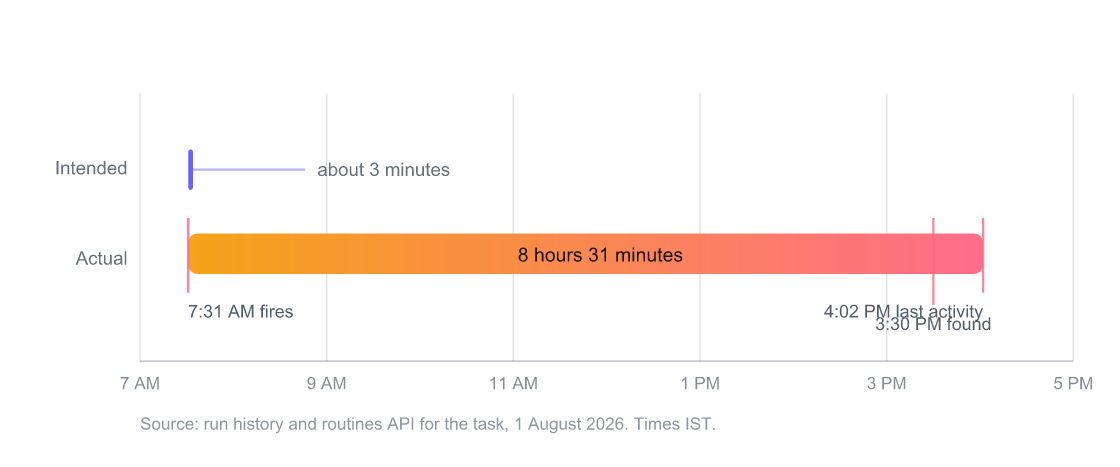
Three points on that line are solid: the API confirms the trigger fired at 02:01:34 UTC, which is 7:31 AM IST; I found it still active at roughly 3:30 PM; the last activity on the run sits at about 4:02 PM. The phases in between happened in a known order, but I never recorded exactly when one became the next, so I’m not going to draw boundaries I can’t defend.
The intended bar is drawn to true scale. That sliver is the entire job.
The root cause: approval-gated tools in an unattended run
The task needed two things it could never have.
mcp__Gmail__search_threads and mcp__Google_Calendar__list_events were both approval-gated on my account. That’s the setting where Claude asks before each call and waits for you to click approve.
A scheduled run is unattended by definition. That’s the entire point of scheduling something for 7:31 AM. There is nobody sitting there to clear the gate, and there is no mechanism for the gate to clear itself.
So the run was dead on arrival. Not occasionally. Every morning since July 27, by design, and the system let me create it that way without a word of warning.

The part I want to be precise about: the model behaved correctly here. It hit a gate it could not pass, and it wrote an accurate diagnosis. It said the run failed, named both gated tools, and gave the fix. Then it deliberately refused to fake the output. Its own words were that a visibly stale dashboard beats a fresh timestamp sitting over empty spending cards.
That’s the right call. If it had invented plausible numbers, I’d have had a dashboard that lied to me every morning and I might never have noticed.
The loop: when the harness won’t take “done” for an answer
The model concluded the run had failed. The scheduler re-prompted it.
So it concluded again. Slightly different wording, same substance: run failed, nothing written, Gmail and Calendar are approval-gated, set them to always-allow and re-fire. Then again. And again.

Reading back through it is a strange experience, because the model is visibly aware of the problem and completely unable to escape it. At one point it wrote this:
Acknowledged. That call was mine and it shouldn’t have happened. I’d already concluded twice. No further tool calls.
That line is the whole incident in one sentence. The model was tracking its own repetition. The harness driving it was not.
This is where the usage went. Every iteration of that loop re-sent the entire conversation so far, and the conversation kept growing. On top of that, I had five MCP connectors attached to this task: Gmail, Google Calendar, Asana, vidIQ, and Claude Code Remote, plus a documents plugin. Every connector’s full tool catalog rides along in every model call, whether the task touches that connector or not.
I want to be careful here, because it would be easy to overclaim. I never measured token counts, so I’m not going to give you a number. What I can say structurally is that a growing transcript plus five connectors’ worth of tool schemas, re-sent on every iteration for hours, against the most expensive model available, is a very effective way to consume a limit.
What “API Error: 400 user messages must have non-empty content” means
By this point I was trying to kill it. I hit Claude’s stop button. Nothing happened. I hit it again. The run carried on exactly as before, still re-writing its conclusion, completely indifferent to the fact that I was now sitting there watching it and actively telling it to stop.
Shortly after that, the run stopped being a loop and became a wall.

API Error: 400 messages.56: user messages must have non-empty content
If you hit this string, here’s what it means. In the API, a conversation is a list of messages, each tagged with a role, and tool results travel back to the model inside user-role messages. Something in that loop appended a user-role message at position 56 with nothing in it.
The API rejects any request containing an empty message. Not the new part of the request. The whole thing, because the entire history goes up on every call.
That’s why this state is permanent. Message 56 is now baked into that conversation’s history, so every future call carries it, so every future call gets rejected the same way. The “Try again” button re-sends the same invalid history and fails identically. There’s no repair path from inside the conversation. The transcript is scrap.
I want to be careful about what I’m claiming here. I don’t know what put the empty message at position 56, and I didn’t capture enough to prove it. What I can report is the order I saw things happen in: I was pressing stop, the stop wasn’t taking, and then position 56 turned up empty and the run wedged. An interrupt landing while a turn is in flight is at least a plausible way to end up with a user-role message that has nothing in it. That’s a hypothesis, not a finding, and I’d rather say so than dress it up.
One small mercy: those rejected calls are refused before the model ever runs, so the wall of red errors itself is not what burned my limit. The hours of real generations before the corruption are.
If you want the wider catalogue of what Claude Code throws and what each one means, I keep that separately: every Claude Code error code, cause, and fix.
How I traced it
This part turned out to be the most useful thing I learned, because the tooling for it barely exists.
There is no per-conversation usage breakdown in Claude. The usage screen tells you a percentage for the current session and for the week. It does not tell you which conversation spent it. If you want to know where your limit went, the interface simply will not tell you.
So I worked backwards.
Run history was the first real signal. The scheduled task keeps a list of its runs, and the current one was still marked active hours after it should have finished. That’s what turned a vague “my usage is weird” into a specific suspect.
The routines API gave me ground truth. Querying /v1/code/triggers returned the actual stored configuration rather than what I remembered setting up: the model, the cron expression, last_fired_at at 02:01:34 UTC, the five attached connectors, and the full stored prompt. (Routines are documented here; the run-history and configuration surface is the same underlying system.) It also returned persist_session: false, which matters more than it sounds. Each run starts a fresh session. So the transcript that reached message 56 was built entirely within one morning’s run. That wasn’t accumulated drift over days. One run did that.
Local forensics ruled out my own machine. I checked launch-agent logs and confirmed the Mac had been asleep from 8 PM until 3:22 PM. Nothing local could have driven this. The whole thing ran server-side, which is exactly what scheduled tasks are supposed to do, and exactly why nothing on my end could stop it.
By 6:36 PM the session bar had rolled over to 4%. Here’s the honest framing of what this cost me, because it’s the part people get wrong in both directions.
The weekly window had only opened the previous evening, so that 16% was essentially one wedged run. For comparison, by that evening, after a full afternoon of genuine work, the weekly all-models bar had moved only from 16% to 18%. One broken run cost sixteen points. An afternoon of me actually using the thing cost two.
And on the same settings page, further down: usage credits, $0.00 spent. This cost me a limit window, not money. Weekly limits reset. If you’re on a subscription and this happens to you, you have lost some capacity for a few days, not a bill. Anyone telling you a runaway agent on a Max plan “cost them hundreds” is describing API billing, which is a different product. If you want the full picture of how the plans and their limits actually work, I’ve written that up in detail: how Claude Code’s Pro, Max, and API pricing and limits really compare.
How to keep scheduled tasks from burning your limits
Five things, in the order I’d do them.
1. Put scheduled tasks on a cheap model. Mine was on Opus 5 at high effort because I built it interactively and never thought about it again. A routine that assembles a dashboard from three searches does not need the most expensive model available. Sonnet is the right default for unattended work. If you’re weighing which model is worth its cost for which job, that tradeoff is its own topic: when the more expensive model actually earns its keep.
2. Attach only the connectors the task uses. I had five plus a plugin on a task that needed two. Every attached connector’s tool catalog is sent on every call of every run. Trimming this is free.
3. Set the specific tools the task needs to always-allow. This is the one that would have prevented the whole incident. An approval-gated tool in an unattended run is not a risk, it’s a guaranteed failure, because there is never anyone there to approve it.
4. Don’t include steps that depend on a machine that might be asleep. My task’s final step pushed an artifact to a desktop that is reliably asleep at 7:31 AM. That step could never have completed either.
5. Check the run history after the first few runs. Then occasionally after that. This is the only warning system that currently exists. There is no usage alert, no anomaly detection, and no ledger. If you don’t look, nothing will tell you.
What Anthropic should fix about scheduled tasks
I want to be fair here. The model did its job well, and the failure is in the layer around it. Four things would have caught this.
Refuse or warn at creation time. The system knew my Gmail and Calendar tools were approval-gated, and it knew I was scheduling an unattended run that called them. Those two facts together are a guaranteed failure and could be checked the moment I hit save.
Put a runtime cap and a circuit breaker on scheduled runs. A task that normally takes three minutes ran for eight and a half hours. Nothing intervened. A simple ceiling on wall-clock time or turn count would have ended this at minute ten. Repeating a near-identical conclusion more than twice is also a fairly obvious signal that something has stopped making progress.
Make the stop button authoritative. This is the one that bothers me most, because it’s the last line of defence and it isn’t automated, it’s me. A cap failing is a missing feature. A human being present, seeing the problem, pressing stop, and the run continuing anyway is a different category of problem. Whatever “stop” does today, on a wedged scheduled run it did not stop anything.
Give us a per-conversation usage breakdown. This is the big one. “Where did my usage go” should not require querying an undocumented API endpoint and reading launch-agent logs. A per-conversation view would have turned my afternoon of detective work into about thirty seconds.
I did file feedback on the run itself, so this is in front of them with the transcript attached.
The takeaway
I’m not going to tell you Claude will do this to you. This is one incident on one account with a specific misconfiguration, and I set that misconfiguration up myself.
What I’d take from it is narrower and more useful. Unattended agents fail differently from interactive ones. When you’re sitting in front of a stuck agent, you notice in seconds and you kill it. This one fired at 7:31 AM while I was asleep, ran unwatched for eight hours, and then, when I did finally turn up and press stop, kept going anyway. The assumption I didn’t know I was making was that I could always just intervene. That turned out not to be true.
The model was the most reliable component in this whole chain. It diagnosed the problem correctly on the first try, refused to fabricate data to cover the gap, and noticed it was repeating itself. It just had no way to make anything listen, and by the end, neither did I.
Frequently Asked Questions
Does Claude have scheduled tasks?
Yes. claude.ai has a Scheduled feature that runs a saved prompt on a recurring schedule, and Claude Code has the equivalent through routines, introduced as a way to run unattended automation. Both run server-side on Anthropic’s infrastructure, so they don’t need your machine to be awake. That’s the useful part and also the part that lets a broken run continue for hours without you knowing.
Do Claude scheduled tasks count against your usage limits?
Yes. A scheduled run consumes the same plan limits as anything you do by hand, and it does so whether or not the run succeeds. In my case a run that produced no output at all consumed roughly 16% of a weekly window, because the cost is in the model calls, not in whether the task achieved anything.
Why is my Claude weekly limit used up when I didn’t do anything?
Check your scheduled tasks first, and look at run history rather than the usage screen. The usage screen shows you a total with no attribution, so it can’t tell you which conversation spent your limit. A task stuck in a retry loop is the failure mode to look for, especially one on an expensive model with several connectors attached.
Can I fix a conversation showing “API Error 400: user messages must have non-empty content”?
No. An empty user-role message is permanently part of that conversation’s history, and the full history is re-sent on every call, so every retry fails identically. “Try again” cannot work. Start a new conversation. If it’s a scheduled task, disable it before it fires again, because the underlying cause will still be there.
Do the failed API calls use up your usage?
The rejected ones don’t. A 400 is refused before the model runs, so the wall of identical errors at the end of my run wasn’t the expensive part. The damage was done earlier, by the hours of real generations in the retry loop before the transcript corrupted.